
Leadership Summit – Chicago – Renaissance Chicago Downtown Hotel – September 17, 2026 Join top AI and Data leaders in Chicago to explore the strategies, governance, and innovations driving enterprise performance. Connect, learn, and gain actionable insights — reserve your seat today.
Webinar | The Multiplier Effect: How Top Data Leaders Translate Infrastructure into Business Impact Hear directly from leading data executives as they share how they are navigating data strategy, AI investment, and business value in the AI era.
Nominate Now | Top 30 Retail Data Changemakers 2026 Nominate for the Top 30 Retail Changemakers 2026, our annual recognition honoring visionary leaders who are redefining the retail landscape through data, AI, and analytics.
Opinion & Analysis
AI Strategy’s Most Expensive Assumption: The Average Customer

Written by: Michael Podgortsev | Director, Data and AI
Updated 10:00 AM EDT, July 29, 2026

Most Chief Data Officers (CDOs) have seen the numbers. IBM puts average ROI on enterprise AI at roughly 6%, below most organizations’ cost of capital. MIT and BCG found around 95% of enterprise generative AI pilots produced no measurable P&L impact. RAND puts AI project failure north of 80%, about double the rate of conventional IT.
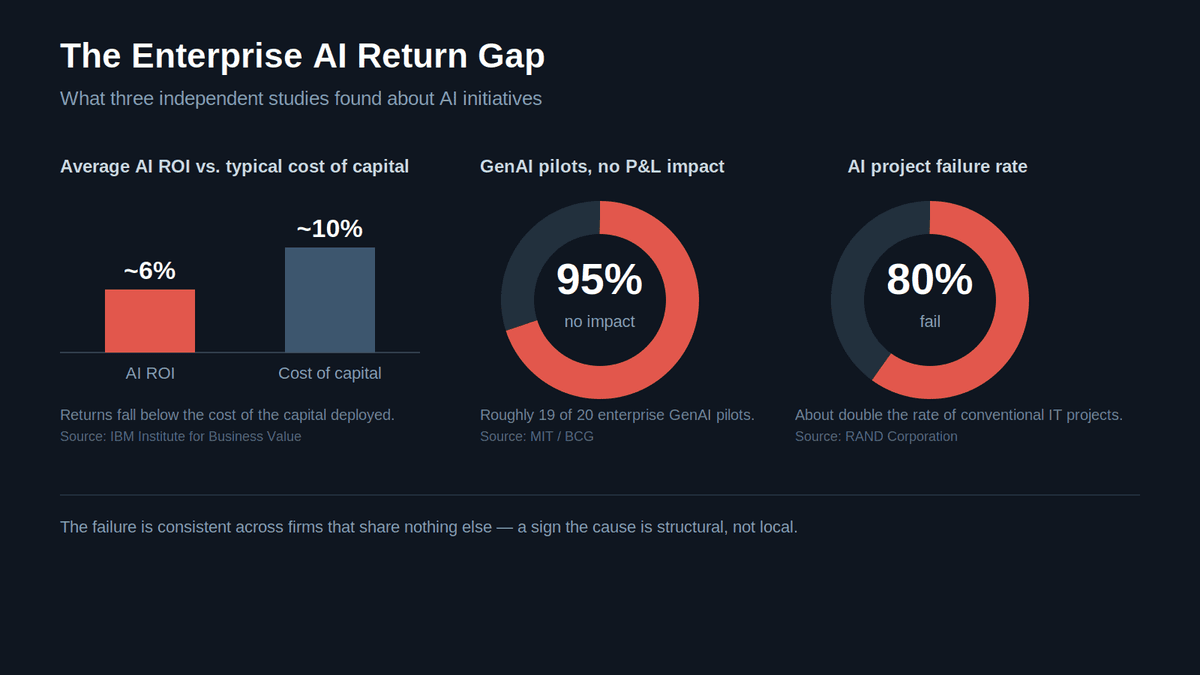
Figure 1: Three recent studies highlight the challenge of translating enterprise AI investment into measurable business value.
We tend to file these under the usual suspects: data quality, talent gaps, weak use cases, change management. All real. But after fifteen years building data functions across startups, mid-market companies, and enterprise, I have come to see them as symptoms of a more fundamental flaw upstream of the problems we usually blame.
The flaw is this: The AI tooling we deploy is optimized for an average that describes almost none of our actual customers, and our governance has no mechanism for detecting the gap.
Why “passed the benchmark” and “works for our customers” are different claims
A foundation model returns the most probable response given its training distribution. For inputs in the dense center of that distribution, it performs well and fluently. For inputs in the sparse regions, the model doesn’t fail loudly. It returns an equally fluent, equally confident response drawn from the closest pattern. Same tone, same latency, no error flag – nothing a standard monitoring layer is typically designed to detect.
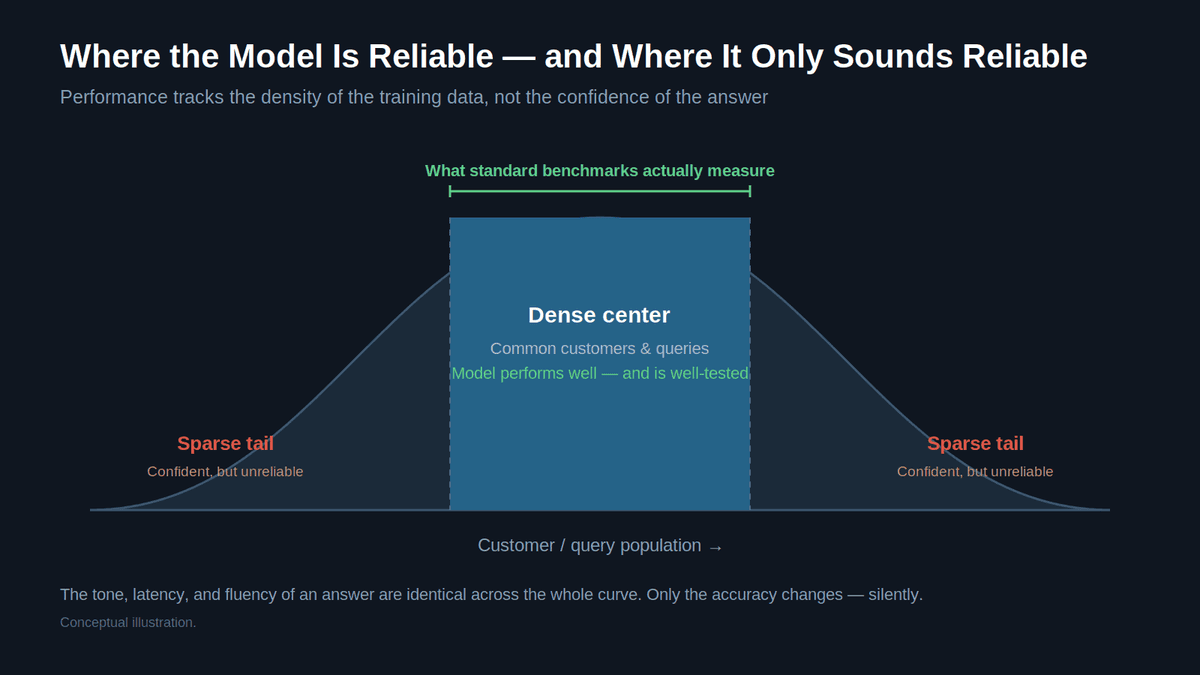
Figure 2: Standard benchmarks measure the dense center of the distribution. The model’s confidence doesn’t fall off in the tails; only its accuracy does.
Consider what this means for evaluation. The benchmarks in our vendor evaluations and model cards measure aggregate performance on test sets drawn, by construction, from the well-represented part of the distribution. They measure the average case because that is what is measurable. The populations where the model is least reliable often have the least targeted evaluation.
So a model can clear every evaluation in procurement and still be systematically unreliable for a segment central to your business. The benchmark and the reality are both true. They are just measuring different populations.
Training-distribution mismatch isn’t the only factor. Enterprise data quality, retrieval strategy, fine-tuning, and evaluation practices all matter, and an AI governance review should account for them. But those are factors we already know how to interrogate. The population gap is what routinely goes unexamined.
The pattern is identical to one we already know
We have seen this structure before, outside of AI. In 2018, Amazon scrapped an internal recruiting tool after it taught itself to penalize female candidates, having learned from a decade of mostly male resumes to downrank anything that deviated from that profile. The model was faithfully reproducing its training data, which reflected who had succeeded under the old filter rather than who could succeed in the role.
This is the same shape as the average-customer problem: a model trained mostly on one population encodes it as the default, then applies it at scale to customers who look nothing like it.
I watched this play out at a financial services firm. Their AI-assisted underwriting tool cleared every vendor benchmark and sailed through procurement. A year in, the dashboards were green. Accuracy, satisfaction, and throughput were all on target, but one regional team kept escalating cases by hand. When we finally segmented the data, the cause was obvious in an afternoon: much of that team’s customer base was self-employed and multi-income, and the tool’s implicit “employed / unemployed” model handled them poorly. It had been confidently wrong for that segment for a year, and nothing in the reporting had isolated them.
The failure mode generalizes: a model performs worst exactly where a population is thinnest in the data, which is often where the need is highest, surfacing only as a slow drift of escalations no one traces to the root.
The governance question worth adding
This is largely a CDO problem, more than a vendor or data-science one, for one reason: the gap is invisible in aggregate metrics, and aggregate metrics are what every other function reports up. An underrepresented population’s degraded experience gets averaged into numbers that look healthy, so the organization can declare success while a specific segment quietly receives worse outcomes.
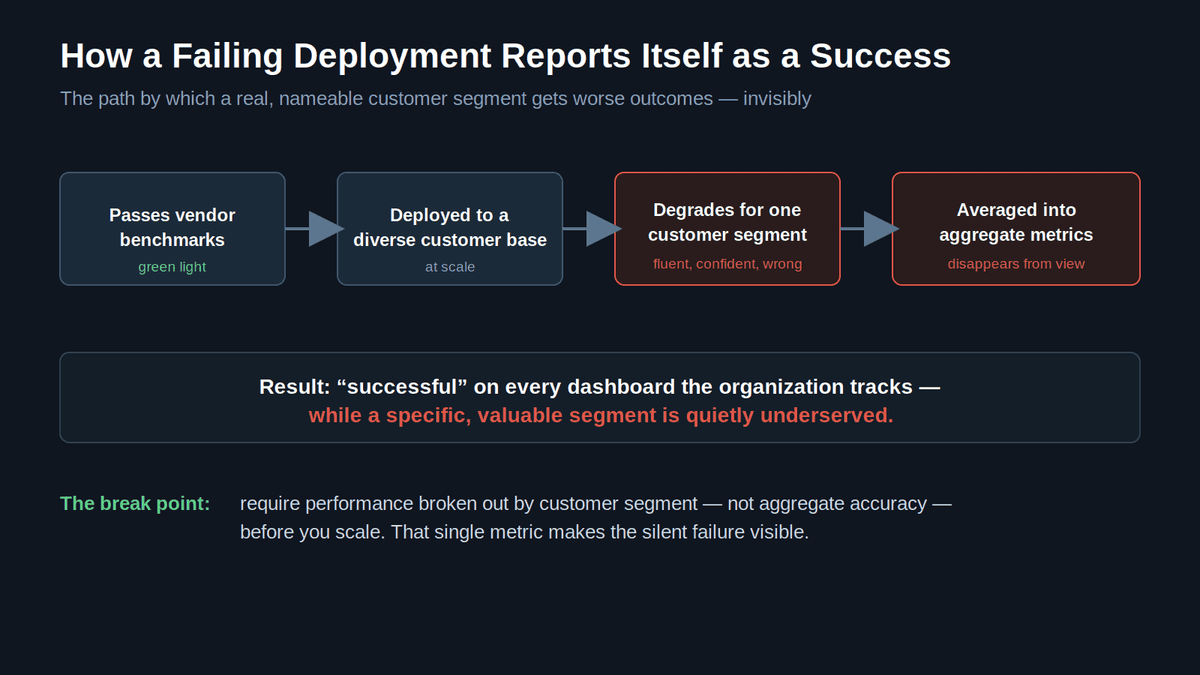
Figure 3: How a deployment that fails a real customer segment still reports as a success, and the metric that breaks the cycle.
Catching that is precisely what our function exists to do, and it won’t get caught anywhere else.
The intervention is relatively low-cost: one question added to vendor due diligence, and one metric added to pilot success criteria.
The due diligence question: Show us what is known about how this model’s training data represents our customer population, and what evaluation exists for use cases like ours beyond standard benchmarks. For most vendors, the honest answer is, “We haven’t tested for those use cases specifically.” That answer isn’t disqualifying – it’s informative because it tells you your pilot should be deliberately instrumented for this population.
The pilot metric: Performance broken out by the customer segments that matter to your business, not aggregate accuracy. The segments where your customers diverge most from the generic training distribution are exactly where you need eyes before you scale.
Identifying those segments doesn’t require new tooling, just a deliberate look. Start from the customer dimensions your business already knows matter: language, region, employment type, customer channel, age, and ask which are likely thin in a generic training distribution. The important, underrepresented segments become your priority list, and most teams can build it in one working session.
From there, the practice has a home in three places you already control. In procurement, make segment-level evidence part of vendor due diligence. In pilot governance, make segmented performance a formal go/no-go criterion. In ongoing oversight, add segment-level drift to the monitoring you already run, so a model that starts fine can’t quietly degrade for one population after it scales. None of these practices requires a new governance function. They add a single dimension to reviews you already have.
The reframe
The 95% figure is not a story about AI failing to work. It is a story about a mismatch between what AI tooling assumes about a customer and who the customer actually is, the same mismatch a recruiting model encodes when it learns “successful candidate” from a biased history.
The most consequential question before your next AI initiative isn’t, “What can this model do?” Vendors are well-prepared to answer that question. The better question is, “How far is our actual customer population from the average this model was optimized for, and where does that gap show up?” Based on the numbers, asking that question is what most determines whether the investment reaches the P&L.
We are the only people in the organization positioned to ask the better question. That responsibility is not a burden; it is the clearest case for the seat at the table we have long argued for.
References
- IBM Institute for Business Value, research on enterprise AI ROI. Figures cited reflect IBM IBV reporting that average enterprise AI initiative ROI has run below organizations’ cost of capital.
- MIT / Boston Consulting Group research on enterprise generative AI adoption, finding the large majority of enterprise GenAI pilots produced no measurable P&L impact. See MIT Sloan Management Review / BCG, “Getting AI to Scale.”
- RAND Corporation analysis of AI project failure rates relative to conventional IT projects.
- Amazon’s 2018 decision to scrap an internal AI recruiting tool that penalized female candidates was first reported by Reuters. “Amazon scraps secret AI recruiting tool that showed bias against women,” Reuters, October 2018.



 Elevate Your Personal Brand